Brotli Saved Forty Percent on Text and Nothing on Your Images

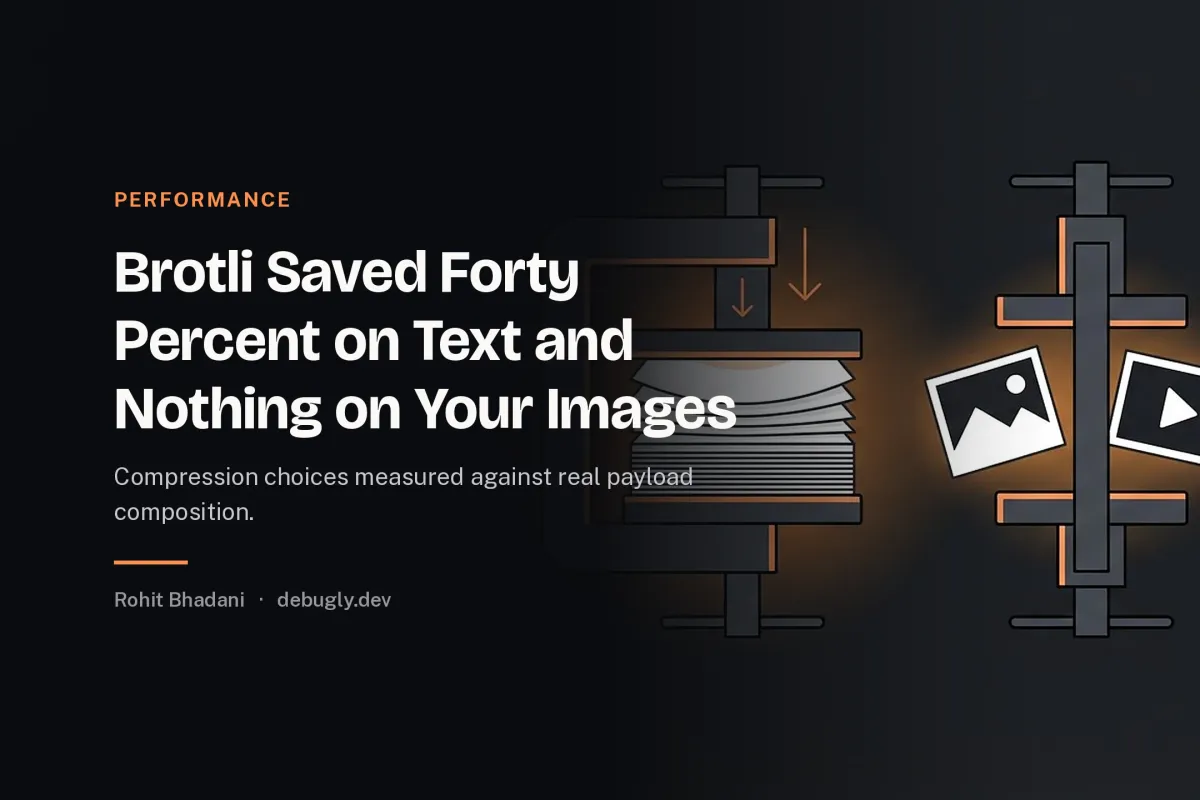
The team switched text compression from gzip to Brotli and the dashboard showed a forty percent reduction in transferred HTML and JavaScript. There was a small celebration. Then we looked at total page weight and it had barely moved, because text was a sixth of the page and the other five sixths were images and video that neither algorithm touches.
This is not an argument against Brotli. It is an argument against celebrating a percentage on the wrong denominator. Compression is a tax cut on a specific line item, and if the line item is small, the refund is small.
This was nginx 1.27 with Brotli enabled, Chrome 133, on a media heavy marketing site and a text heavy documentation site, which conveniently showed both extremes.
What Brotli actually improves on
For text assets, HTML, CSS, JavaScript, JSON, Brotli at a sensible quality level compresses meaningfully better than gzip, typically ten to twenty percent smaller, more on repetitive markup. On the documentation site, where text is most of the weight, the switch was a clear win and users on slow networks felt it.
The cost is CPU at encode time, which is why the standard practice is to pre compress at build time rather than compress on the fly. Brotli encoding is slow. Pre compressed static files remove that cost entirely and let you use a higher quality level than you could afford live.
For dynamic responses you can still use a low Brotli level or stay on gzip, because the marginal saving does not pay for the encode latency on every request.
The denominator problem
The page we optimised transferred about 2.4 MB. Of that, roughly 400 KB was text that compressed well. The rest was:
| Asset | Compressible | Share of page |
|---|---|---|
| JPEG and WebP images | No, already compressed | ~60% |
| Video and fonts | Mostly no | ~20% |
| HTML, CSS, JS | Yes | ~17% |
| SVG and JSON | Yes | ~3% |
A forty percent saving on the 20 percent that is compressible is an eight percent saving on the page. The dashboard showed forty. The user got eight. Both numbers are true, which is what makes the chart misleading rather than wrong.
This is the same wrong denominator failure as optimising the mean in p99 and why averages lie, applied to bytes. The metric improves on the slice you touched. The experience improves on the whole.
Compression does not stack
A subtle point that keeps tripping people: you cannot meaningfully compress what is already compressed. JPEG, WebP, AVIF, MP4, WOFF2 are all compressed formats. Running gzip or Brotli over them saves a few percent at best and costs CPU for the privilege. Some servers still gzip images by misconfiguration, paying encode cost on the origin and gaining nothing.
So the honest checklist before choosing an algorithm is: what fraction of my bytes are in a compressible format. If the answer is small, the algorithm choice barely matters, and the real work is image format, dimensions and delivery, which is the srcset story in serving a 2400px image to a 390px phone.
What I would actually do, in order
Fix the images first. Format choice and correct dimensions routinely halve the biggest line item. That is a larger win than any text compression change, and it compounds with caching.
Then pre compress text at build time. Ship Brotli for the browsers that accept it and gzip as the fallback, served from static files so no request pays encode cost. Configure the server to prefer Brotli when the client offers it.
Set Vary correctly. Vary: Accept-Encoding so caches do not serve a Brotli body to a client that only asked for gzip. A misconfigured Vary produces the confusing "works in one browser, broken in another" cache bug.
Measure the page, not the asset. After the change, compare total transferred bytes and, more importantly, load milestones on real devices and real networks. If LCP does not move, the win is on a dashboard, not in a user's experience.
The honest numbers
To give the algorithm its due, on the documentation site the story was reversed. Text was most of the weight, Brotli cut it substantially, and load times on a throttled connection improved by a second or more. There, the celebration was warranted.
So the answer to "should we switch to Brotli" is genuinely: it depends on your payload composition, and the dependency is measurable in ten minutes with a transfer breakdown. The mistake is not in choosing wrong. It is in not looking at the composition and then attributing user benefit to an asset level percentage.
The rule
Compression is a discount on compressible bytes. Compute the discount against the whole bill before celebrating, and remember that the biggest line items on the modern web do not qualify for the discount at all.
If your compressible fraction is small, your performance work lives in image delivery, caching and critical path, and compression is a rounding error you configure once and forget. If it is large, Brotli pre compressed at build time is one of the cheapest wins available.
Either way, the discipline is the same as every other performance post on this site: measure the thing the user experiences, and treat every asset level chart as a hypothesis about it. The hero image case, where a single asset decides the milestone, is your hero image is lazy loaded.
The configuration, for completeness
For those who want the concrete setup, pre compress at build time and let nginx serve the stored files. Enable both gzip and Brotli modules, set brotli on with a static brotli_static on so pre compressed files are used, keep gzip_types covering text, css and javascript, and add Vary: Accept-Encoding. Confirm with curl -H 'Accept-Encoding: br' -sI that the response carries Content-Encoding: br and that the content length reflects the compressed size. Ten minutes of configuration, measured against the whole page, is the entire win.