The Span Per Tool Call That Made One Agent Step Debuggable
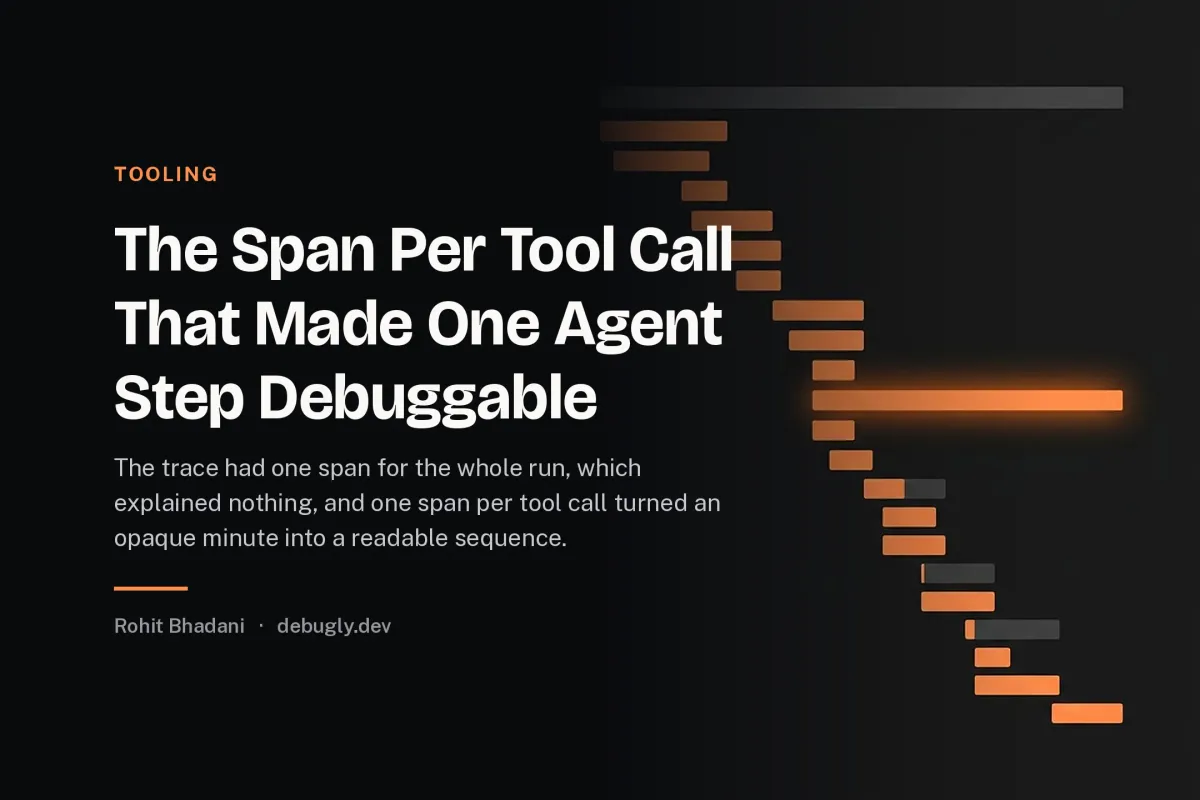
The trace had one span for the whole run, which explained nothing, and one span per tool call turned an opaque minute into a readable sequence with a single…

It ended at the minute becoming four seconds. It started at the minute. Every hand-off in between did exactly what it was told, and this is the one that lied.
This is the anatomy of the trace granularity, and of the specific property that makes the coarse trace useless: a span that covers the whole run reports the total, and the total is the number the user already gave you, so the trace adds nothing and the debugging starts from scratch.
This was an agent with five tools, and the mechanics are the same for any multi-step LLM pipeline.
Why one span explains nothing
The span is the unit of the trace, and the unit is the granularity, and the granularity is the resolution, and the resolution is what the trace can show, and the one span is the coarsest resolution, and the coarsest is the total, and the total is the duration, and the duration is the known, and the known is the nothing, because the trace's job is to explain the duration, and the explanation is the breakdown, and the breakdown is the parts, and the parts are the spans, and the one span has no parts, so the trace has no explanation.
The agent's minute is composed of steps, and the steps are the model calls and the tool calls, and the calls have different costs, and the different costs mean one step dominates, and the dominates is the finding, and the finding requires the breakdown, and the breakdown requires the spans, and the spans require the instrumentation, and the instrumentation is the work, and the work is the fix, and the fix is the granularity.
The coarse trace is worse than no trace, because the trace's presence is the assurance, and the assurance is the reason nobody instruments further, and the not further is the dead end, and the dead end is the cost, and the cost is the debugging from scratch, and the scratch is the logs, and the logs are the grep, and the grep is the slow path, and the slow path is the incident's duration.
What the span per tool call showed
The instrumented trace had twelve spans, and the twelve were the steps, and the steps were the sequence, and the sequence was readable, and the readable was the finding, because one span was fifty two seconds, and the fifty two was the search, and the search was the tool, and the tool was the vector query, and the query was the unindexed scan, and the scan was the slow, and the slow was the fix, and the fix was the index, and the index was the four seconds.
The fifty two seconds was invisible in the one span trace, because the one span said a minute, and the minute was the total, and the total hid the fifty two, and the hidden was the finding, and the finding was the granularity, and the granularity was the span, and the span was the tool call, and the tool call was the search, and the search was the fix.
This is the same discipline as tracing LLM pipelines with minimal observability, and the shared property is the one worth fixing.
How to instrument it
One span per tool call. The tool invocation is the span, and the span's name is the tool, and the name is the label, and the label is the reading, and the reading is the sequence, and the sequence is the diagnosis, and the diagnosis is the fix, because the span's duration is the tool's cost, and the cost is the finding.
One span per model call. The model call is the span, and the span carries the token counts, and the counts are the cost, and the cost is the bill, and the bill is the metric, and the metric is the optimisation, and the optimisation is the fix, because the model call's duration is the prefill and the decode, and the two are the latency's parts.
Carry the correlation identifier. The run's identifier is on every span, and the identifier is the join, and the join is the trace, and the trace is the sequence, and the sequence is the reading, and the reading is the diagnosis, and the diagnosis is the fix, because the spans without the identifier are the unrelated events, and the unrelated are the unusable.
Record the input size, not the input. The span carries the token count and the tool's argument size, and the size is the cost's proxy, and the proxy is the diagnosis, and the diagnosis is the fix, and the not recording the input is the privacy, and the privacy is the constraint, and the constraint is the reason to record the size rather than the content.
Alert on the span, not the run. The slow span is the alert, and the alert is the detection, and the detection is the prevention, and the prevention is the fix, because the run's duration is the user's complaint and the span's duration is the cause, and the cause is the actionable, and the actionable is the fix.
What I now do
A trace with one span for the whole run reports the total, which is the number you already had, so it explains nothing. Emit one span per tool call and per model call, carry the correlation identifier, record sizes rather than contents, and alert on the slow span.
The agent took a minute and the trace said a minute, and the minute was the complaint, so the trace was useless until it had twelve spans, and the twelve showed one search taking fifty two seconds. The lesson I keep is the property, not the incident.
Published on debugly.dev by Rohit Bhadani | Founder of Krova Cloud