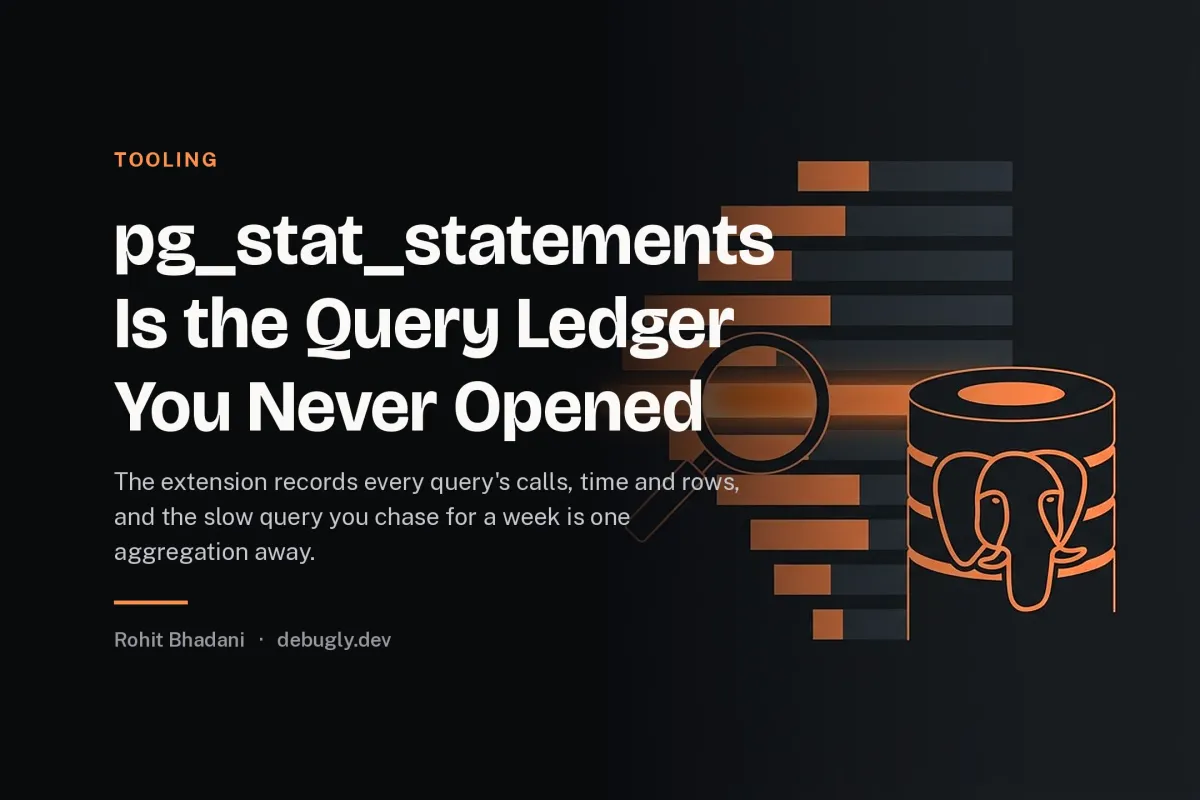
pg_stat_statements Is the Query Ledger You Never Opened
The extension records every query's call count, total time and rows, normalised by shape, and the slow query you chase for a week is one aggregation away…

The investigation had reconstructed the workload from application logs, guessing which queries ran and how often, for two days, and the answer was one query away the whole time, because the database had been recording every query's call count, total time, mean time and rows since boot, in a view, normalised so that a query with different parameters is one row, which is exactly the aggregation the investigation needed, and the view is one extension away, and the extension, on the server in question, was not enabled, which is the state it is in on most servers, which is why the ledger, the most complete record of the workload, is the one nobody opens.
This is the reading guide for pg_stat_statements, the queries that answer the incident questions, and the one decision, enabling it, that turns a guessing investigation into a lookup.
This was Postgres 16.3, and the numbers below are the view's columns, which are few, and the questions are the incident's, which are many, and the mapping is the whole skill.
Enabling the ledger
The extension requires a shared library loaded at start, a one line in the config, plus creating the extension in the database, and the cost is a small, bounded overhead, a hash table of query shapes, which is the price of the ledger, and the price is worth it on any server where a slow query is an incident, which is every server. The normalisation replaces the parameter values with placeholders, so the ledger holds shapes, not values, which is also its privacy property, the parameters, the data, are not stored, only the shape and the statistics, which makes the ledger safe to keep and safe to share, which the raw query log is not.
The ledger resets only on command or restart, so it accumulates over the uptime, and the accumulation is both its power and its trap: a query that was hot last month and fixed last week still shows its historical cost, so the reading must window it, by resetting after the baseline, or by diffing two snapshots, which is the rate discipline from reading /proc like a dashboard, applied to the ledger: the counter is a total, and the incident needs a rate, and the rate is a diff.
The queries that answer the questions
What is the workload. Ordered by total time, the top shapes are where the database spends its life, and the total time is calls times mean, so the top is the product, which surfaces the query that is merely frequent against the one that is merely slow, and the product is the truth, because the database's time is the budget, and the top of the total is the budget's spenders.
What is slow per call. Ordered by mean time, the slow shapes appear, which is the latency view, and the mean against the p99 is not in the view, but the stddev of the time is, and a high stddev against the mean is the bimodal query, the cache hit and miss mixed, which is the signature of the query that is fast until it is not, per the query that was fast until the table grew.
What is the N plus one. The shape with the highest call count, especially a call count that dwarfs the requests, is the loop's confession, a query called thousands of times per request is the N plus one, and the calls per request, estimated by dividing by the request rate, is the multiplier, which is the detection from finding N plus one queries, made a single row.
What reads too much. The rows column against the rows returned, where available, is the scan's confession, a query that reads a million rows to return ten is the missing index or the wrong plan, and the read to return ratio is the selectivity the planner failed, which is the index not being used, and the common root is the property, not the platform.
The reading discipline
The ledger is a ranking, and the ranking is the hypothesis generator: the top shapes are the candidates, and each candidate then gets the EXPLAIN, the per query deep dive, because the ledger says where to look and the plan says why, and the division is the efficiency, the ledger scans the workload in one query, and the plan scans one query in depth, and the investigation that skips the ledger does the plan's depth on the wrong queries, chosen by anecdote.
The reset is the experiment: reset the ledger, run the suspect workload, read the delta, and the delta is the workload's isolated ledger, which is the profiling run, and the isolation is the property that turns the accumulated ledger into a causal one, because the delta contains only what the run did.
The traps
The ledger normalises by shape, so a query built by string concatenation, with values inlined, is a new shape per value, and the ledger fills with one call shapes, which is both the ledger's pollution and the application's SQL injection surface, per SQL injection inside the ORM you trusted, and the two are the same defect, the unparameterised query, seen by the ledger as a thousand shapes, which is the ledger's way of naming the injection, in statistics.
The ledger also does not see inside the prepared statement's generic plan, so a plan that degraded per the generic plan story shows as a mean time increase on an unchanged shape, which is the ledger's signature of the plan cache problem, the shape constant and the time climbing, which is the diagnosis from the slow query that ran in four milliseconds under EXPLAIN, at the aggregate level.
The rule I keep
pg_stat_statements is the workload's ledger, every shape with its calls, time and rows, one extension away, and the incident questions, what is the workload, what is slow, what loops, what over reads, are each one aggregation on it, windowed by a reset or a diff.
The two day investigation that reconstructed the workload from application logs was a ledger query that never ran, because the ledger was off, and the extension's one line of config is the cheapest observability in this archive, and the most absent, which is the combination that makes its absence, not the slow query, the real defect.