Performance
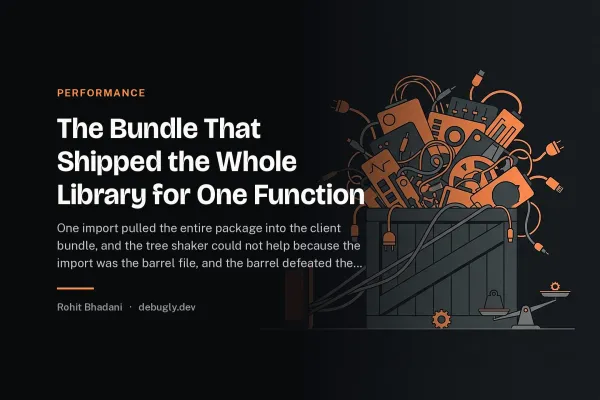
The Bundle That Shipped the Whole Library for One Function
One import pulled the entire package into the client bundle, and the tree shaker could not help, because the import went through the barrel file, and the…

Performance
One import pulled the entire package into the client bundle, and the tree shaker could not help, because the import went through the barrel file, and the…
Code Review
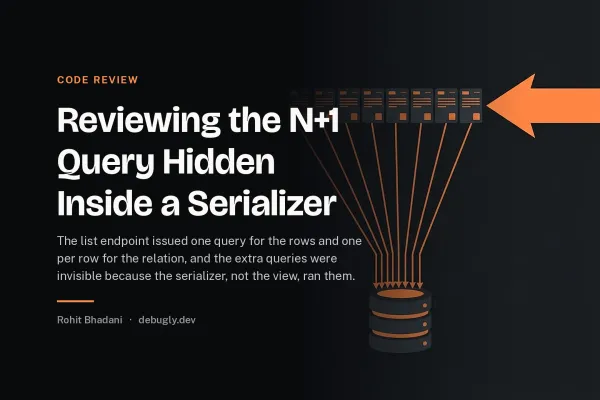
The list endpoint issued one query for the rows and one per row for the relation, and the extra queries were invisible in the view because the serializer…
Performance
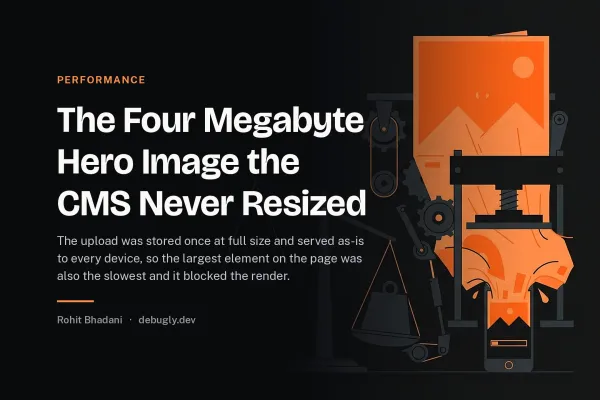
The upload was stored once at full size and served as-is to every device, so the largest element on the page was also the slowest, and it blocked the render…
Tooling
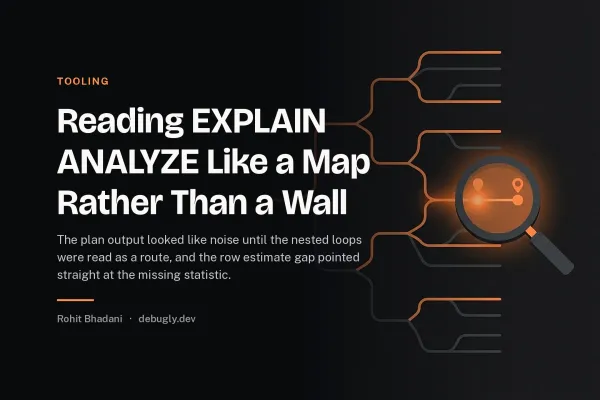
The plan output looked like noise until the nested loops were read as a route and the row estimate gap pointed straight at the missing statistic, and the…
Deep Dive
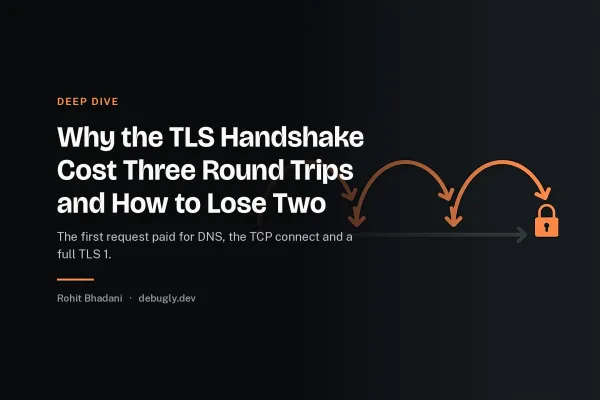
The first request paid for DNS, the TCP connect and a full TLS 1.2 negotiation before a single byte of the response arrived, and the round trips were the…
Performance
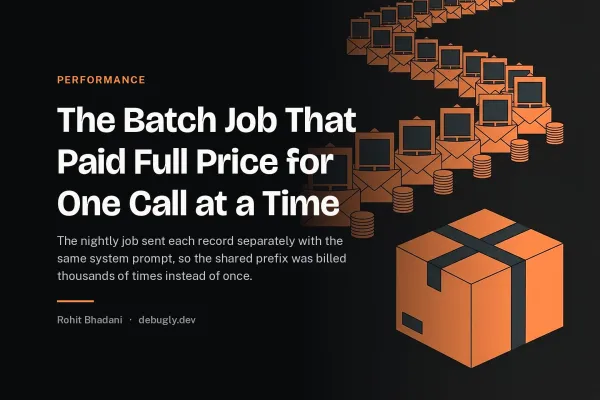
The nightly job sent each record separately with the same system prompt, so the shared prefix was billed eight thousand times instead of once, and the bill…
Deep Dive
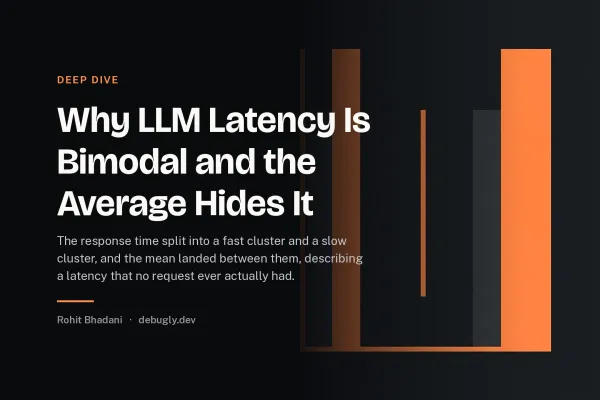
The response times split into a fast cluster and a slow cluster, and the mean landed in the empty space between them, describing a latency that no request…
Performance
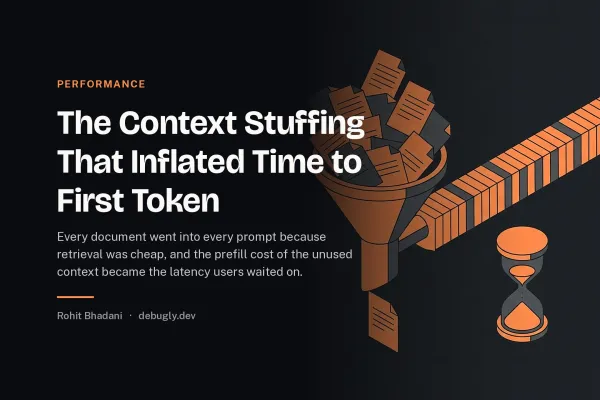
Every retrieved document went into every prompt because retrieval was cheap, and the prefill cost of the context nobody read became the latency users waited…
Bug Hunt
The generated pattern passed every test in the suite, then a single long string made it run for nine minutes. The pattern was not wrong.
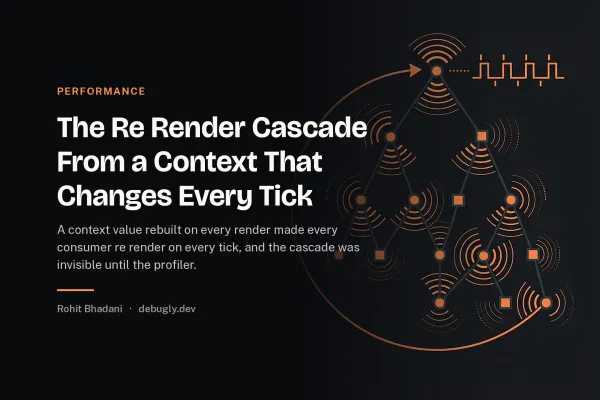
Performance
A context value rebuilt on every render made every consumer re render on every tick, and the consumers included the provider's own parent, so the cascade…
Tooling
The extension records every query's call count, total time and rows, normalised by shape, and the slow query you chase for a week is one aggregation away…
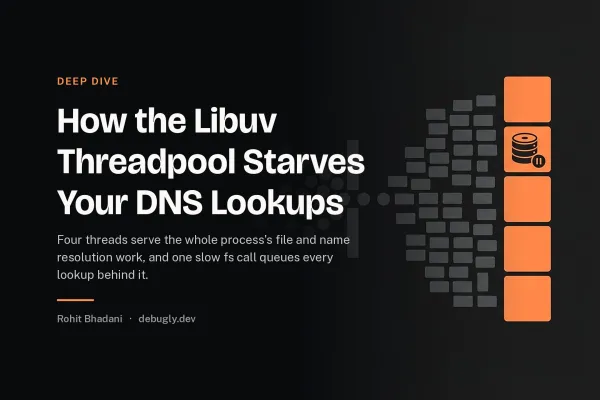
Deep Dive
Node's DNS and file system work share a threadpool of four threads by default, and one slow file read queues every lookup behind it, so the event loop is…